Introduction
Shopping malls, restaurants, factories and offices around the United States are closed and 30 million citizens have filed for unemployment to date. Many are either furloughed or laid off, and only those deemed “essential,” or who have the capacity to perform their duties remotely, are resistant to Covid-19’s financially corrosive effects. Using the April 2020 iteration of the Grinnell College National Poll (GNCP), in this post I explore who in the United States is experiencing financial hardship during this global pandemic.
The version of the GNCP I am using in my analysis was administered by Selzer and Co. between March 27th and 30th, released on April 1, 2020. The interviews were conducted in English using a random sample of landline and cellphone numbers that included 1,009 U.S. participants aged eighteen and older.
Index Variable
To explore the topic of financial hardship, I created an index variable using a question battery on the survey. The question reads as follows: “For each of the following, please tell me if this is something that has already happened because of the coronavirus, if you expect it to happen in the near future, or if you do not expect it to happen anytime soon.” The responses used for the index variable are: lost wages or personal income; gone hungry because of difficulty obtaining food; become unable to pay a regular bill, such as rent or a mortgage or utility bill; had difficulty getting needed medical care; had difficulty getting basic services you rely on, such as meal services, public transportation, or government benefits; or, been laid off or furloughed from work.
For each form of hardship, respondents who indicated they have already experienced it, or expect to experience it soon, are coded as 1. I then summed each form of hardship into a single index variable measuring overall hardship. The variable ranges from zero to seven—zero meaning that the respondent experienced none of the forms of hardship, and seven indicating that they have experienced all of them.
Analysis
To begin the analysis, I selected eight demographic variables to regress against the financial hardship variable. These demographic variables were reasonably associated with poverty informed by a 24/7 Wall St. special report.[1] I performed an Ordinary Least Squares (OLS) regression analysis on age, educational attainment, income, gender, race, whether respondents have children at home, area classification, and region.
Figure 1
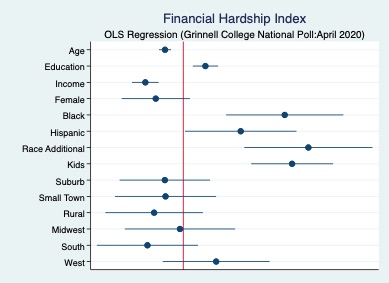
Figure 1 depicts my OLS regression analysis. It shows regression coefficients and their 95% confidence intervals. It also shows the direction of the correlation, positive if to the right of zero, and negative if to the left. Accordingly, the variables we see as significantly related to financial hardship are age, educational attainment, income, being black, being Hispanic, or having kids at home. Additionally, the race variable is structured to place people who refused to identify with a race, or who identify as being of a race with a very small sample size in the poll, in a category labeled “additional.” This category also has a statistically significant relationship with hardship.
Age is negatively associated with financial hardship—meaning as age decreases, financial hardship rises. With the economy at stand-still, and a recession looming, young people are among the most vulnerable because they have less experience in their careers as opposed to those with more robust relationships. These consequences may be long lasting. Young people who graduate in a recession, see substantial earning losses, lasting up to ten years, and are more likely to take jobs at smaller, low-paying firms.[2]
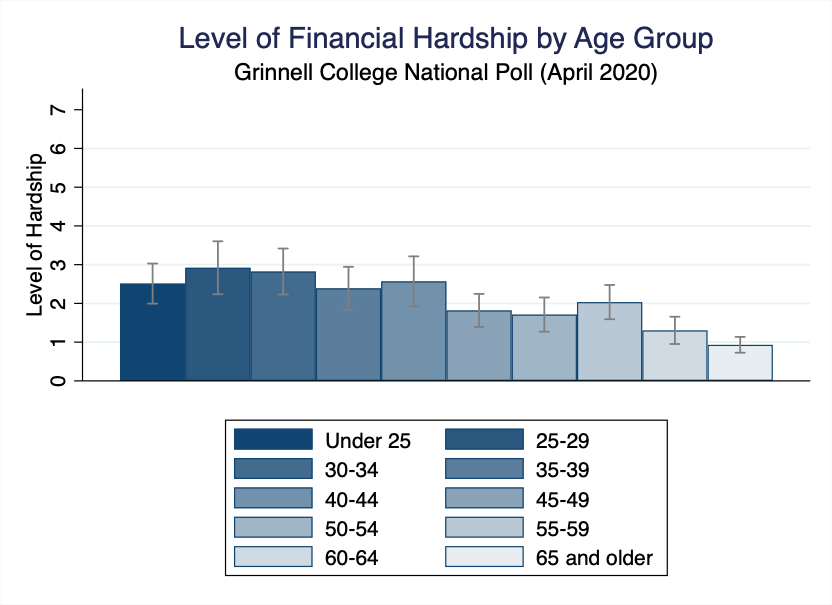
I decided to parse age by placing it in categories. Figure 2 illustrates the relationship. The group who is experiencing the greatest level of financial hardship is between the ages of 25 and 29 with an average score of 2.91. The lowest level of hardship is the 65 an older category with a mean index score of 1.09. As a reminder, the index score can be interpreted as the average number of forms of economic hardship being suffered by the group in question. In this case, people between 25 and 29 on average had experienced or expected to soon experience approximately three of the forms of economic hardship mentioned in the poll, compared to just one by those 65 and older.
Figure 2
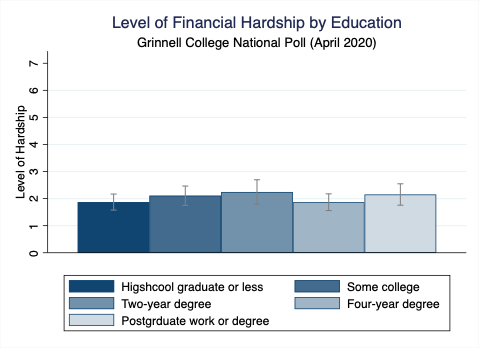
Next we look to educational attainment and its relationship to financial hardship. It has a slight, but positive relationship with the index variable. It is interpreted to mean that those with higher levels of education are most likely to experience financial hardship.
Figure 3 depicts this slight positive relationship. Those with a two-year degree have the highest index score of 2.04, while, surprisingly those with a high school degree or less have the lowest score at 1.72. This finding is counter-intuitive, as we might expect those with a lower level of education to have higher levels of hardship. However, the effect observed here is also very small.
Figure 3
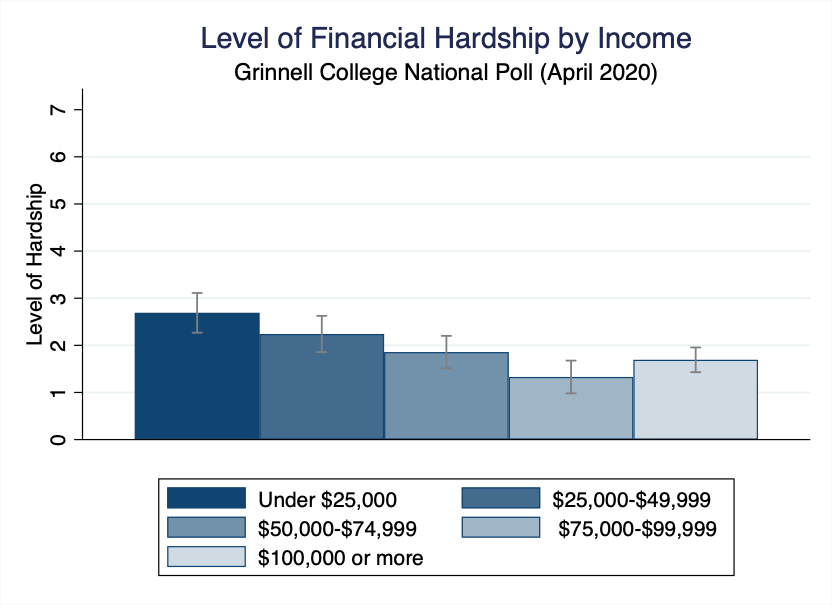
Consistent with expectations, income has a negative relationship with financial hardship. Those who earn less money are statistically more likely to experience financial hardship. This relationship is given form in Figure 4. Those facing the greatest hardship are respondents making $25,000 or less, with an average index score of 2.4. In contrast, respondents experiencing the lowest amount of financial hardship are those earning between $75,000 and $100,000. This income level has an index score of 1.4.
Figure 4
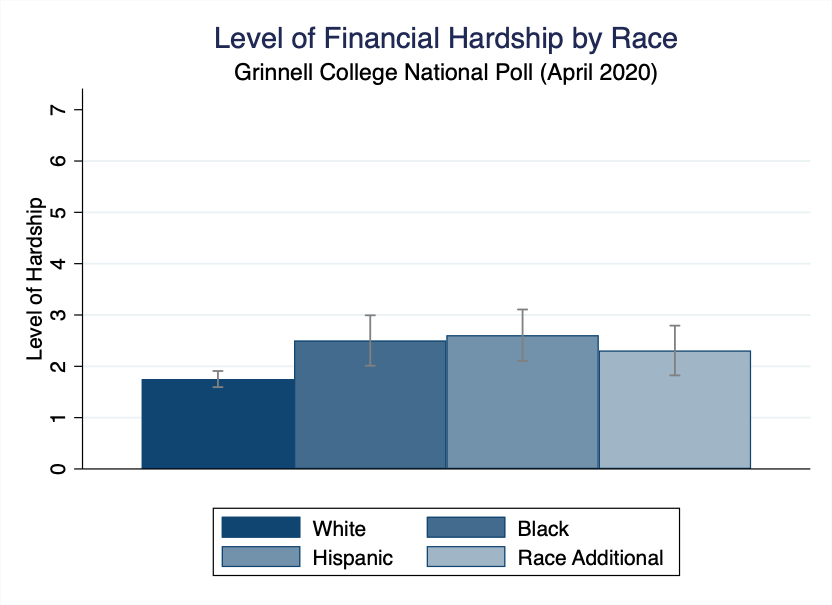
Next I looked at race. Respondents on the poll were asked to self-identify according to ethnicity or race. Figure 5 also includes a category called race-additional. This variable combines the Asian, Native American, other, and multi-racial demographics. This was done in response to the small number of respondents in each group.
Race is a significant factor in whether someone experiences financial hardship. Here we treat racial identification as a dummy variable in which white respondents serve as the base. Being black, Hispanic, and of the race-additional category are all positively correlated with hardship. Figure 5 shows the relationship between financial hardship and race. The white category has an index score of 1.6, black people have an index score of 2.38, Hispanics average 2.56, while the race-additional is at 2.6. These finding suggest people of color are experiencing financial hardship to a greater degree than their white counterparts.
Figure 5
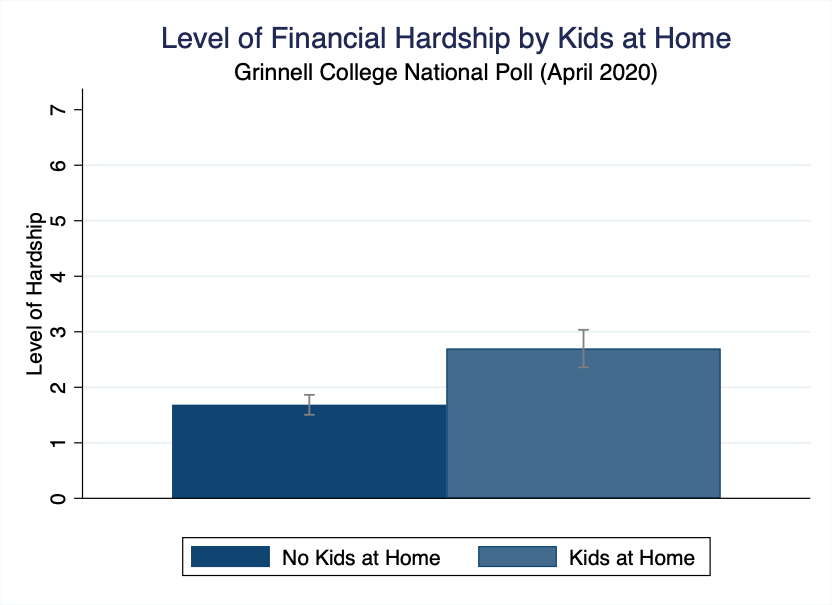
Lastly are those respondents who have kids at home. This relationship is depicted in Figure 6. There is a strong positive relationship between having children at home and facing financial hardship due to Covid-19. Those who don’t have children at home have an index score of 1.58, while those who do have kids average 2.63. Statically speaking, this analysis suggests that those with children are one and half more times likely to experience financial hardship.
Figure 6
Conclusion
I analyzed the April 2020 version of the Grinnell College National Poll to explore the financial impacts of the Covid-19 pandemic in the United States. This analysis demonstrated that the demographic variables that statistically associated with financial hardship are age, income, education, race, and individuals who have kids at home. Specifically, those experiencing the greatest levels of financial hardship are those who are young, low income, are people of color, or who have children at home.
Max Hill ‘20 is a political science major at Grinnell College with a concentration in statistics.
Note: this post was edited for publication by Associate Professor Peter Hanson.
References
Frohlich, Thomas C., et al. “Poverty in America.” 247 Wall St., 27 Sept. 2017, 247wallst.com/special-report/2018/09/27/poverty-in-america/10/.
Nesvisky,
Matt. “The career effects of graduating in a recession.” (2012).
[1] Frohlich, Thomas C., et al. “Poverty in America.” 247 Wall St., 27 Sept. 2017, 247wallst.com/special-report/2018/09/27/poverty-in-america/10/.
[2] Nesvisky, Matt. “The career effects of graduating in a recession.” (2012).