Software Review: NVivo as a Teaching Tool
For the past few weeks, DASIL has been publishing a series of blog posts comparing the two presidential candidates this year – Hillary Clinton and… Read More »Software Review: NVivo as a Teaching Tool
For the past few weeks, DASIL has been publishing a series of blog posts comparing the two presidential candidates this year – Hillary Clinton and… Read More »Software Review: NVivo as a Teaching Tool
The start of the school year is a time many students start putting thought into what disciplines to study for the remainder of their collegiate… Read More »Investigating the Spatial & Temporal Trends of Declaring a Major
As you may know, education spending in the United States is chronically low, totaling six percent of the total federal funding per year. … Read More »School-to-Prison Pipeline: School Funding
Political Science majors enter politics. Biology majors become physicians. History majors…wind up teaching history. We’ve heard it all before: The major you declare during your college days has a strong influence on your career options and your marketability in those fields. The data presented in this “Grinnell College Career Paths” visualization help to debunk the “major=career” myth. It also reveals the complexity of the career development process. Especially in a liberal arts setting, where conversations of transferable skills and experiential education abound, students choosing a career should consider both their major and experiences gained outside of the classroom.

Your first glance at these data might be at one of the potential majors you are considering. Let’s say you find your Anthropology classes fascinating. You could read your textbooks all night and find yourself conversing with classmates during lunch about the topics you’ve learned. These are all good signs. However, at some point, you might ask yourself, “What can I do with this major?” According to the data presented here, an Anthropology major can lead you to any number of fields. There is a fairly equal spread of career paths — from public service to information systems — chosen by Grinnellian Anthropology majors. How do you decide which path might be a better fit for you? Similar to how you figured out whether or not you like pancakes. You gave it a try, or, as we formally suggest, you participate in some form of experiential education. You get your feet wet in the world of work via serving, interning, or shadowing. Additionally, you talk to alumni about their career paths. You do all of this with the intention of discerning if this particular path aligns with your strengths, interests, and values, and is something you’d like to pursue long-term. Learning about — and being able to articulate to others — the transferable skills of your Anthropology degree is essential to applying your major to whatever field you choose.
The School Breakfast Program, like the more familiar National School Lunch Program, provides subsidized meals to school children. Researchers have found that eating a nutritional breakfast at school improves students’ academic performance, reduces disciplinary problems, and increases the likelihood that students eat a healthful meal.
Unfortunately, when it comes to reaching children from low-income households with this program Iowa has long ranked near the bottom of states. On an average day in October 2013, Iowa served approximately 40 free and reduced-price breakfasts for every 100 free and reduced-price lunches. Based on a similar score, the Food Research and Action Center, a national nonprofit organization that studies hunger in the United States and advocates for nutrition and anti-hunger policies, ranks Iowa’s School Breakfast Program coverage as 47th out of 50 states and DC.
Assuming October to be representative of the school year, our state’s poor performance means that thousands of low-income children in Iowa are failing to access this important program. What might explain this? And should we be concerned?
Of course, some families and children may not choose to participate in the program. But long bus-rides, increases in the number of school children in poverty, and the demonstrated benefits of the program means we should think through making the program as accessible as possible.
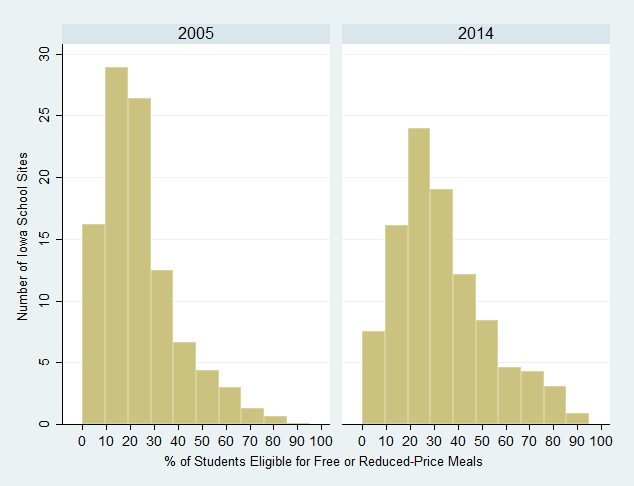
The figure below includes two histograms showing the increasing number of school sites (that is, elementary, middle school, and secondary schools) with larger percentages of children eligible for free and reduced-price meals. According to Census data, the percentage of Iowa school children from households at or below the poverty line rose by approximately 2.5 points during this period. Of course, as the state grows the absolute number of children in poverty grows as well (unless the rate were to fall). In the end, the rate increase and the growth in population means approximately 20,000 more students from families in poverty attend Iowa schools compared to just a decade ago.
