
Excessive use of force by law enforcement is by no means a novel phenomenon in the United States. However, with high-profile cases like Michael Brown, Eric Garner, and most recently Greg Gunn, fueling national movements such as #BlackLivesMatter, race-related incidences of police brutality are receiving worldwide media attention.
I investigated geographic trends in reported police brutality, using Los Angeles County at the census tract level and data from The Guardian’s project “The Counted,” a comprehensive dataset that records all people killed by police and other law enforcement agencies in the US, for the year 2015.
To measure the effect of location on incidences of police brutality, I conducted a hot spot analysis, which identifies statistically significant spatial clusters of high (hot spots) and low police brutality (cold spots). Essentially, the hot spots/cold spots indicate whether observed spatial clustering of police brutality events is more pronounced than if the values were randomly distributed. We specified the spatial relationship for the analysis as Contiguity Edges, meaning that census tracts that share a boundary or overlap with a census tract that contains a police brutality event will be weighted more that those that don’t in the analysis.
Below is a map depicting the results of the hot spot analysis.
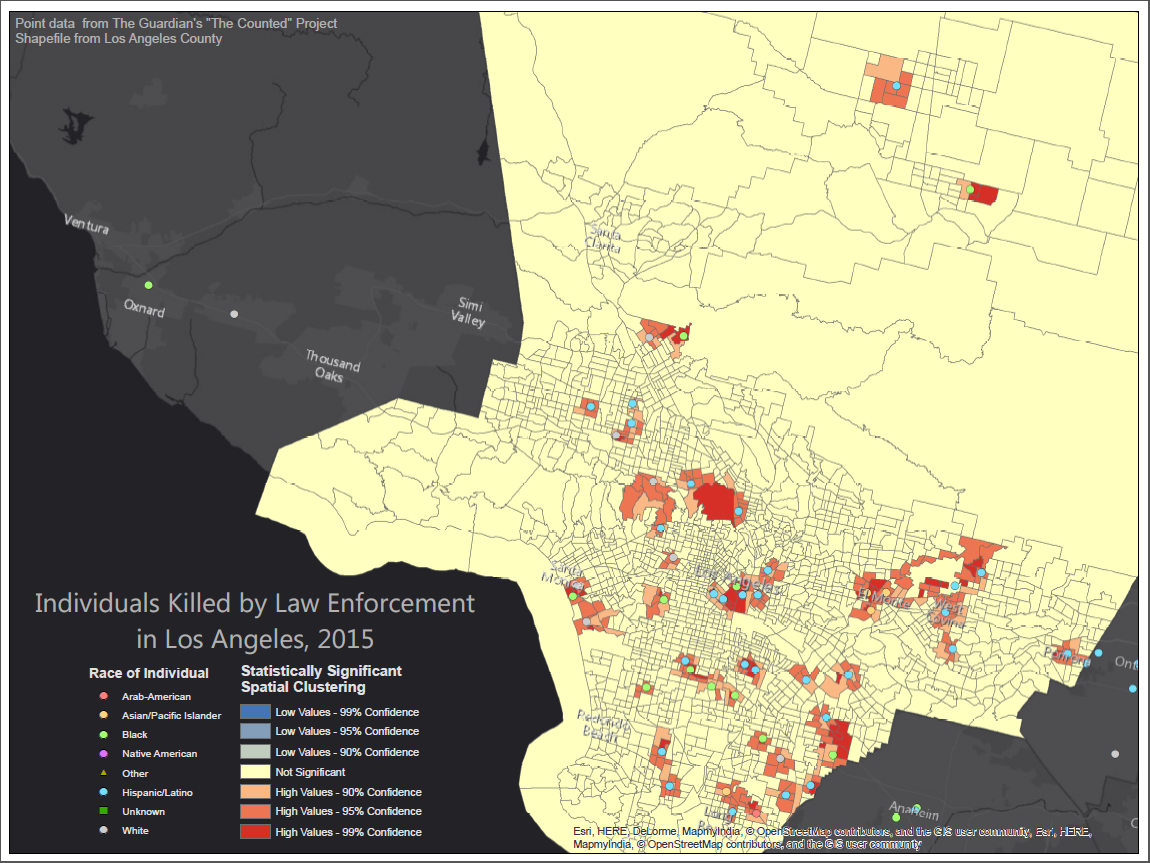
The hot spots depicted in the map reveal the relationship between location and the occurrence of police brutality. The neighborhoods enveloped in hot spots are those with an abnormally high number of police brutality events, indicating that these areas may be disproportionately affected by excessive use of force by law enforcement.
Looking demographically at both the incidences themselves and these hot spot neighborhoods can shed some light on why these areas have abnormally high police brutality. Right off the bat, the number of blue and green dots (Hispanic/Latino and black victims, respectively), dominates the map. Breaking down by race, there were 30 victims of Hispanic/Latino descent, 11 black, 4 Asian/Pacific Islander, 7 white, and 1 Arab-American. In addition, most of the incidences with blacks as victims happen in LA neighborhoods that have a large population of blacks, such as Willowbrook and Westmont. The same trend also appears when focusing on Hispanic/Latino victims: most Hispanic/Latino victims died in neighborhoods with large populations of Hispanics/Latinos, such as Los Angeles proper and Eastern LA County (Baldwin Park, Irwindale, West Covina).